
Fast-speaking Koijen talks about the financial markets with great passion. His main focus is why financial markets fluctuate as much as they do. “If on a given day the market rises or falls, you can usually come up with a few possible reasons. But no one really knows. Even when quarterly figures are published, we have a hard time explaining why share prices go up or down. That is one of the crucial questions that my collaborators and I are asking”, says the professor.
 Before discussing the content of his research, we talk about the current schools of thought concerning financial markets. We consider issues such as factor investing and the famous Fama and French models, which has been a hot topic since the 1990s. We realise that a great deal is still unclear about the impact of ESG on the financial markets. We also discuss Koijen’s views on the use of alternative data, which has become a frequent occurrence in the light of Big Data.
After discussing the recent research on factor investing, we continue our interview by discussing Koijen’s research. With his research on inelastic markets, he tries to explain the dynamics of financial markets using holdings data to trace price fluctuations back to the demand of different investors. Holdings data for equities have been available in the US since the 1980s, but it is only now that we have methods and frameworks for to use these data in equilibrium asset pricing models. For fixed income markets, the availability of these data is quite good in the US for investmentgrade credit market, but more limited for other parts of fixed income markets. And in the European Union the availability of holdings data for equities as well as for bonds is organised differently from that in the US, but detailed, high-quality data are available in recent years. With holdings data broadly available, these new frameworks and methods can be used to provide a new perspective on why prices move and how markets function.
SECULAR DEVELOPMENTS IN THE ACADEMIC AND THE INVESTMENT WORLDS
FACTOR INVESTING
Factor investing has become very popular in recent decades, both in academic research and in the asset management industry itself. However, the proliferation of factors poses some challenges according to Koijen. Just for equities, hundreds of factors have been proposed in the literature. Such factors are often based on company-level characteristics and may also use macroeconomic data. “There is an ongoing debate whether those are always real factors or whether data mining has sneaked in”, Koijen remarks.
“An active literature explores how to use machine learning methods to efficiently combine all this information. This is quite challenging and the connection to the underlying economic forces is not obvious. If it would be possible to limit the set of factors, then perhaps it would be easier to determine the relationship between these factors and the fundamental drivers, and thus gain a better insight into the economic dynamics. However, it has been challenging to reduce this large number of factors to a small set of economically-interpretable factors”, Koijen continues.
HOLDINGS DATA ARE OF IMPORTANT VALUE IN ADDITION TO PRICES AND FIRM CHARACTERISTICS TO UNDERSTAND FINANCIAL MARKETS
One concern is that the set of factors that investors may change over time. We have seen a variety of global financial market trends in recent years, including the 2008 credit crisis, the problems in Greece, the pandemic, and now we may be faced with stagflation. If the ambition of the multi-factor model is to adequately model the developments in the markets, then such a multi-factor model should be capable of explaining all those developments6. This may be challenging using current methods and modelling approaches.
Koijen and his collaborators decided to take a different approach to try to understand financial markets. At its core, any asset pricing model combines a model of investors’ portfolio choice with market clearing to solve for asset prices. The main idea behind the new approach, which they label “demand system asset pricing,” is to return to this core and model the demand of each investor. The new data that are used are then portfolio holdings and flows.
This modelling approach has four key advantages. First, a wellspecified demand system is essential to obtain credible quantitative answers to questions that involve shifts in investors’ demand. Examples include the impact on asset prices of (i) the growth of ESG investing, (ii) the transition from active to passive investing, (iii) quantitative easing and tightening, and (iv) global capital flows, just to name a few. Those key economic questions cannot be easily answered without modelling the demand of investors. Second, by modelling the demand of each investor, fluctuations in asset prices can be traced back to the demand of different investors. This makes markets more interpretable and shines a light on the dark matter of financial markets. Third, asset pricing models make strong predictions about the asset demand system. By directly estimating investors’ demand, it provides a new way of testing and improving asset pricing theories. Fourth, by taking this granular perspective, it also provides a new way to explore return predictability. Instead of directly predicting returns using firm characteristics or macroeconomic variables, the demand system approach instead predicts the demand of investors and then aggregates these forecasts to a forecast for returns. We will revisit these themes below.
MUCH IS STILL UNCLEAR ABOUT THE IMPACT OF ESG
What are your views on the impact of ESG on the theory and science of investing?
Now that we have established the challenges for major new developments within the multi-factor framework, we move on to the promising subject of the recent developments in the field of ESG investing. We wonder what impact ESG investing is having on the theory and science of investing.
“Conceptually, the asset pricing models that incorporate ESG-conscious investors can be viewed as adjustments to asset pricing frameworks where investors have tastes for certain characteristics. This in and of itself is not radically different. One implication of these models is that as ESG investing becomes more popular, prices of highly-rated stocks increase and expected returns fall. However, during this transition period, average realized returns are a poor proxy for future expected returns. That said, there is an ongoing debate about how large the flows to ESG securities are, how to properly define these securities and measure the flows, and what the ultimate impact on prices is. At the end of the day, the real question is to what extent ESG investments are having an impact on what you are trying to achieve. Do they have an impact on decarbonisation and that sort of thing?” the skeptical professor explains.
Koijen refers to a recent conference, where it was argued that “brown” firms may actually be the main source of new developments in terms of important green patents. “The oil and gas sector is a major innovator in this area. But many ESG investors may no longer own oil and gas companies or reduce their allocations. A technology company, for instance, may already be quite green and it is relatively easy for them to come up with a transition plan that would make them net zero in modest amount of time. But if the real innovation in fact comes from the other group, then we may need to rethink the investment strategies. As measuring the effect on asset prices (and the passthrough to investment and green R&D) is challenging, the evidence is not yet conclusive, even though some investors and policymakers have strong opinions on these questions. There is clearly a lot of effort and focus on these questions, so hopefully we can make serious progress on these important issues”, says Koijen.
More broadly, there is a concern that the passthrough from firms’ cost of capital to real investment decisions and R&D is quite low. So if funding costs for ESG projects are lower, what is the additional investment in green projects? There is an ongoing debate whether engagement is more effective, and this may well be the case”, Koijen notes.
ALTERNATIVE DATA AS A SHORT-TERM SOURCE OF FUNDAMENTALS
At the moment, alternative data are seen as the gateway to applying Big Data in financial markets and as a source of alpha. We wonder what Koijen’s thoughts are on this subject. Koijen has a slightly different view but sees many interesting applications for Big Data technologies within the sector.
With alternative data you often try to make better predictions of a firm’s short-term fundamentals compared to your peers. For instance, by scanning the parking lots at retail stores or by using credit card data to predict a company’s upcoming quarterly results, expecting that prices will move when other investors learn these quarterly figure.
But in my view, there is already a wealth of data that we can use that is relatively unexplored, namely data on holdings and flows. By modelling and predicting the demand of different investors, we can predict prices using by predicting demand. Alternative data can be useful as another source of forecasting demand, yet I cannot yet tell how useful it as we have not explored this”, says Koijen.
As the interview continued, we move on to the research area that Koijen is focused on. Holdings data are informative about a key element of his theory about why financial markets are not elastic and enable him to explain some of the effects that we are seeing. We now move on to a more detailed discussion of his research and his ideas about the future.
INELASTIC MARKETS
Together with Xavier Gabaix (Harvard University), Koijen has proposed a new model to explain fluctuations in the aggregate stock market. They jointly published a paper in which they show that certain investor groups, such as retail investors, can have a much greater impact on equity market returns than had previously been assumed. Six months after the GameStop circus7, this conclusion fell on fertile ground. It received a lot of attention in the financial press worldwide.
The core focus of this research is the elasticity of markets. Previously, standard models assumed that markets were elastic. In the CAPM model, assets are very close substitutes and your portfolio weight is determined by a stock’s beta and the amount of idiosyncratic risk. “If an investors wants to buy more shares of Apple, other investors quickly make way and rebalance to other technology stocks”, Koijen explains. Prices therefore do not need to move much for markets to clear. This logic still applies, although to a lesser extent, at the level of the aggregate stock markets versus, for instance, bonds. Standard theories imply that investors’ demand uis very sensitive to changes in expected returns.
According to the study by Gabaix and Koijen, markets are in fact inelastic. Stock market prices react more violently than should be the case for more elastic markets. For instance, if you buy 1% of the aggregate stock market, the market will rise by between 3% and 8%.
To understand why markets can be inelastic, Gabaix and Koijen look at the investment behavior of various market participants. We know that the investments of institutional investors far outweigh those of private investors, but they are typically restricted by mandates. Pension funds and insurance companies have an equity-to-bond ratio of, for instance, 60/40. If the market falls, they will very gradually bring their positions back to their target levels. Investment funds that already have 100% of their assets invested in equities are also unable to provide elasticity, because they are already fully invested in equities.
Koijen believes that hedge funds, too, do not have the room for manoeuvre that is necessary to make the market more elastic. When stock markets fall, hedge funds are also having to deal with an outflow of assets and risk constraints tighten. “You can consider all the various parties, but you won’t be left with many likely candidates who can provide a lot of elasticity. This means that certain investor groups, such as retail investors, foreign investors, and classes of institutional investors, can have a greater impact than you would expect. Every euro that they invest on the stock market, has a five times greater impact, because the rest of the market does not react much”, Koijen argues.
While there is a debate in the literature on the exact magnitude, but that misses the point. In fact, based on the assumption that markets are elastic, the price impact should be close to 0. Based on the evidence so far, markets appear to be inelastic and that means that suddenly many question that never used to be all that interesting become worth investigating”, the professor notes.
RETAIL INVESTORS CAN HAVE A SIGNIFICANT IMPACT ON PRICES
The paper also provides a conceptual clarification on how to measure the flow into the stock market. This is not entirely obvious as for every buyer there is a seller. “The theoretical framework shows that we need to first compute the flow into all asset class for each investor. Then those flows need to be aggregated using equity weights, that is, the fraction that they invest in equity markets. While this analysis provides conceptual clarity on how to measure the flow into the stock market (or into any other asset class), the data to measure these flows perfectly is not publicly available as you need to know the holdings and flows in all asset classes”, says Koijen. However, as holdings data are increasingly available, the measurement of such flows will improve over time.
SHARE BUYBACKS AS A DEMAND SHOCK
So-called share buybacks are the media’s darlings. Our model provides a potential mechanism how share buybacks can have an effect on asset prices. If you simply pay a dividend, you don’t know what investors will do with that money. Will they reinvest it in the market or will they use it for consumption? When a company buys back shares, this creates a direct flow in the market and prices will rise. Not only is demand increasing, but supply will also diminish. That is why dividend payments and share buybacks may have a different effect,” says Koijen. Quantifying those effects is challenging however, and these results are therefore best viewed as a theoretical possibility at this stage. It also opens up broader questions how firms can act as arbitrageurs by changing the supply of shares in response to price movements.
FLOW INFORMATION AS A STEERING INSTRUMENT FOR THE ECB AND FED
These insights are also relevant for central banks’ purchasing policies. Central banks have been buying large quantities of government bonds, corporate bonds, mortgage securities and in Asia even equities. If you want to understand the impact of such actions or want to know how far prices need to rise before someone else will start selling their equities or bonds, you need a demand model.
ASSET DEMAND FOR THE CROSS-SECTION OF U.S. EQUITIES
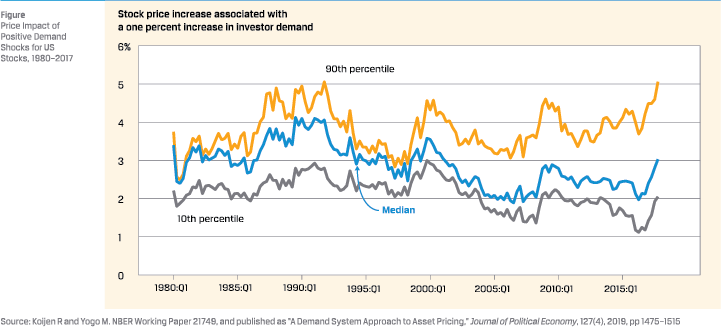
Together with Motohiro Yogo (Princeton University), Koijen studies the cross-section of U.S. equity prices and returns using 13F data. Whenever possible, Koijen includes every single investor in his research. What BlackRock does, what Vanguard does, ABP: everybody. These data make it possible to monitor investors’ behaviour. So for instance, if market participants start to follow the low volatility factor, that would be measurable.
Koijen and Yogo find that demand is inelastic across U.S. equities. The following figure illustrates this effect for US equities. The figure shows by what percentage the stock price moves in response to a 1% change in demand. This clearly indicates inelasticity. This effect is also reflected in well-known factors, such as value, and in other asset categories, such as bond markets.
His research suggests that the 13F holdings data allow a much more detailed analysis. For instance, if a stock gains 10% in value. then the model attributes this to, for instance, 1% due to a change in the demand of Vanguard, 2% for BlackRock, et cetera. With this information in hand, one can try to understand why investors bought or sold securities. “Were asset managers receiving inflows, or did they respond to changes in firms’ fundamentals”, is how Koijen outlines the potential underlying causes of market movements. The research so far is largely focused on developing frameworks to incorporate information in holdings data and flows, but these frameworks can be used to explore those new questions.
 The research also aims to predict the future demand for equities for each investor. So if during a certain period the stock market or the volatility is higher or actually lower, some investors will be quicker to adjust their positions than others. “It is very much bottom-up compared to predicting returns directly,” says the professor.
“Modelling the “demand shocks”, as he calls them, that determine investors’ demand is a different approach to using factor models. An advantage of this approach is that model quickly adjust to structural changes in the market, for instance due to an influx of retail investors” Koijen argues.
“The availability and timeliness of holdings data is not the same for every market. In the US, all institutional investors report their positions on a quarterly basis and that also applies to foreign investors. You can find these data on their 13F forms. The current threshold is 100 million in invested assets. This covers 70% of the total market capitalisation. And then of course you have the short sellers. Those data are also available, but the big unknown factor for us has been the private investor”, says Koijen. In ongoing research, Koijen and his collaborators also have data on holdings of (ultra-) high-net-worth individuals.
Hence, a key new source of information are data on holdings and flows. These are usually not taken into account by factor models. In hindsight that may be surprising, because outside the field of finance it is rare to only focus on prices and not on quantities. This would be like asking labour market economists to study wage trends but ignore unemployment.
“The idea to estimate asset demand systems is not new. In 1960s and ‘70s, James Tobin and Benjamin Friedman (among others) tried to estimate financial that way. However, due to limitations in terms of available data, modelling approaches, and econometric methodologies, this literature ended in the eighties and factor models have been successful in the academic literature and asset management industry since then”, the professor comments.
“Interestingly, the SEC data have already been available for 40 years. These data have been used, but not for equilibrium asset pricing models. So we can run analyses on a quarterly basis for a 40-year period. That is of tremendous interest to us, and we have discovered many new data sources in the process, both from public and private sources. New data are now emerging from all sorts of nooks and crannies.”
EUROPEAN CREDIT SPREADS
Koijen and Yogo have developed a model for global equity and fixed income markets that can be used to shed light on the European sovereign debt crisis- not commissioned by the ECB, by the way. Their conclusion: the spread between Greek and German government bonds can be entirely explained based on fundamentals. This is not the case, however, for Italy and Portugal. Next, we can look at the demand shocks – because all investors in the world are covered – and which countries drive the spreads. This used to be referred to as contagion or spillover effects, but we know exactly which investors cause such spillovers. The ECB could perhaps put this information to good use. If spreads in Italy surge, we now know which market participants are causing this and this may in turn guide policy.
So for policymakers this could serve as a dashboard that would allow them to fathom the causes of price movements and their scale. But all this is still a work in progress; it will take us a few more years and there is still a great deal that we do not yet understand.”
CAN COMPANIES PLAY AN IMPORTANT ROLE AS ARBITRAGEUR?
This transparency of holdings data is a prerequisite for such a dashboard. And that has not gone unnoticed by the ECB. With its securities holdings statistics, the ECB has taken a huge step towards greater transparency. Since the autumn of 2013, we know for each country and each sector exactly who holds what – for every security, such as every equity and bond.
They also have these data for the 26 biggest banking groups. So the ECB has already taken a huge step towards making the holdings data available now and using these for research.
And there is another dataset, the EMIR data, for derivatives. The ECB therefore has a good overview of both the cash market and the derivatives market. The next question is how to jointly model those markets. The data and frameworks often go together. That then allows you to start asking better questions.
BOND MARKETS
In the US we have fantastic data for equity holdings, through the 13F filings, but such data is more limited for Treasuries and parts of the corporate bond market. While that is typically something that you would want to have as a policymaker.
During the liquidity events in March 2020, the Fed intervened in the corporate bond markets. At a time like that you would want to have solid holdings data for Treasuries and corporate bonds.
From a policy perspective, it looks as if Europe has made bigger strides than the US. But these are great times, because we now have new frameworks and holdings data that we can use. We are witnessing an interest in this from within the sector because you can of course use this for predicting returns. And for policymakers it is relevant for dealing with stability issues.
What is key, is that we try to find out what the holdings data can tell us about demand, or rather demand systems. And one of the main outcomes of that study has been that based on that framework markets are inelastic.
THE DEMAND FOR TRANSPARENCY
Of course from a scientific point of view increased transparency is valuable. For policymakers, too, it is valuable to know who holds what positions. In March 2020 things went horribly wrong in the Treasury market. And there was limited transparency in positions. From the perspective of central banks, it is important also to know how investors substitute to other assets if the central bank buys Treasuries or corporate bonds”, Koijen discusses.
The sector, too, advocates (more) transparency. Two years ago, one of the SEC commissioners proposed raising the reporting threshold for large investors from USD 100 million to USD 1 billion. That would have meant a huge reduction in the amount of 13F information8. Scholars started a petition to stop that from happening. And then many large investors also decided that it would be a bad idea, because they would have to report their positions while smaller investors would no longer have to do so. The SEC then found to its surprise that small hedge funds also believed it was a bad idea. Because they used the 13F data, literally everyone felt that raising the threshold would be a bad idea. And so it did not happen, Koijen explains enthusiastically.
Koijen ends the interview with the conclusion that by adding holdings data a huge new dynamic has emerged. If you consider Big Data and machine learning, then holdings data are a very logical application. Before, you would have 3,000 stocks and a number of characteristics. Now you have 3,000 stocks and thousands of investors. By adding the holdings data, a huge dimension is added (the countless investors that all have their own characteristics too). And then suddenly Big Data methods become highly relevant.
Notes
- https://twitter.com/rkoijen
- https://www.koijen.net/
- https://www.aqr.com/
- https://www.chicagobooth.edu/faculty/directory/k/ralph-koijen
- http://bernacerprize.com/ralph-koijen/
- https://mba.tuck.dartmouth.edu/pages/faculty/ken.french/ data_library.html
- https://www.scu.edu/ethics/focus-areas/business-ethics/ resources/robinhood-reddit-and-gamestop-what-happenedand-what-should-happen-next/
- https:/www.sec.gov/comments/s7-08-20/s70820.htm
in VBA Journaal door Mark Geene, Roy Hoevenaars and Sander Nooij