
Pension funds around the world are increasingly investing in alternative assets, and the most important of these “alternatives” is real estate. We employ the CEM global pension fund database to shed light on the determinants of pension fund allocation to real estate, both over time and in the cross-section. We find that pension funds’ strategic allocation to real estate – net of return effects – is the result of the historical performance of real estate relative to other asset classes, and that pension funds quickly adjust their actual allocation rate to their strategic allocation decisions. We do not find evidence of return chasing, and attitudes toward market risk, measured by the credit risk spread and the term spread, do not seem to play a role in the real estate allocation. Finally, while we find that pension fund real estate allocations have increased over time, this is not the case when we correct for capital appreciation: in terms of real estate assets, pension fund portfolios are generally getting smaller, most notably in the U.S.
1 INTRODUCTION
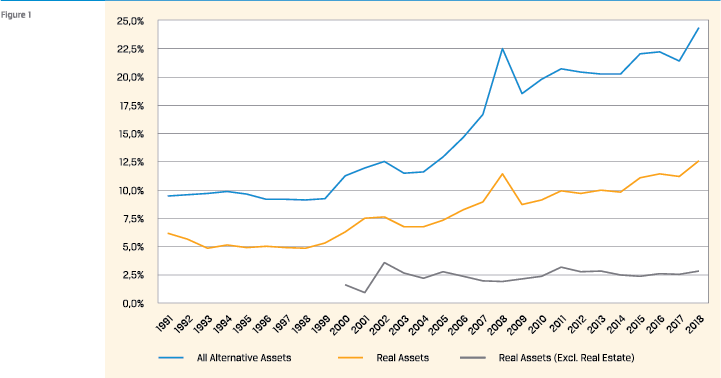
Allocations to alternative assets by pension funds around the world have been increasing over the past decades, and real estate plays a key role in that development. Figure 1 illustrates this trend. The global allocation to alternatives of pension funds reporting to CEM was about 10% in the 1990s and then started increasing to levels of about 20% in the last decade. Overall, allocations to real assets went up from levels of about 5% to 10% in the same period – a doubling of the allocation.
 The big “alternatives” trend is still ongoing. For example, CalPERS, the largest pension fund in the U.S., recently announced its intention to increase the allocation to real assets (82% of which is real estate) from 13% to 15% by fiscal year 2023. But even as the numbers show an increased allocation to real estate over time, cross-sectional differences between pension funds are substantial. Many pension funds do not invest in the asset class at all, while the Pension Fund for the Dutch Construction Industry, for example, allocates some 20% of its portfolio to real estate. Little is known about the causes of the variation in pension fund real estate allocations, both in the cross-section and over time. This article aims sheds light on pension fund allocation decisions in real estate. There is some literature regarding allocation decisions and fund flows, but typically not for pension funds, and neither specifically for real estate. Most papers on the subject study both how capital flows affect subsequent returns and how past returns affect fund flows. This has been studied for public equities (Froot et al, 2001), private equity (Gompers and Lerner, 2000; Kaplan and Shoar, 2005), mutual funds (Karceski, 2002), and public and private real estate (Ling and Naranjo, 2003; Fisher et al., 2009).
 Froot et al. (2001) show that flows into equities (i.e., stocks) depend on historical returns and find evidence of return chasing. Specifically for emerging equity markets, the authors also find that inflows are predictive of future returns. For private equity, Gompers and Lerner (2000) and Kaplan and Schoar (2005) show that capital flows into private equity funds are positively related to past performance as well. Ling and Naranjo (2003) find return chasing behavior for capital flows into real estate investment trusts (REITs), but only in the short term, but this appears to reverse for periods of two quarters and more. Fisher et al. (2009) study private real estate, both in the short and long run, and do not find that returns to private real estate are predictive of future capital flows into or out of private real estate, either at the national or regional level. In other words, they find no evidence of return-chasing behavior for private real estate.
However, these studies do not examine the source of fund flows. Pension funds are at the top of the investment chain, and their decisions ultimately determine the allocation to different asset classes and investment styles. To date, not much is known about the allocation decisions of pension funds when it comes to real estate. In fact, to our knowledge, there are no papers that study the determinants of pension fund asset allocation choices. The main contribution of our paper is to fill this gap, with a focus on real estate allocations.
THIS ARTICLE STUDIES THE DYNAMICS OF GLOBAL INSTITUTIONAL CAPITAL FLOWS INTO REAL ESTATE, USING INFORMATION ON MORE THAN 1,000 PENSION FUNDS IN THE CEM DATABASE
We use the database of CEM, a Toronto-based company that tracks the investment choices and portfolios of over 1,100 pension funds globally. This database is the richest of its kind and not only provides insights into how pension funds invest in different asset classes, but also provides information on the nature (i.e., public, corporate) and maturity of the fund, the performance benchmarks used, and their strategic allocation to asset classes. Within the real estate allocation, CEM includes both public and private equity investments in real estate, distinguishing between in-house, fund, and fund-of-fund allocation strategies. This database has been used before to study pension fund decision-making, for example by Andonov et al. (2015, 2017, 2022).
In the remainder of this paper, we will first present the data and provide sample statistics from our global pension fund dataset. We then present the statistical methods we use, followed by a section in which we present and comment on the results. We end the paper with conclusions and a discussion of practical implications.
2 DATA AND VARIABLES
For the empirical analysis, we use annual data from 1991 to 2018. The capital flows and return variables, among other pension fund data, are constructed and retrieved from the CEM database. In addition, we extract macroeconomic variables from FactSet as explanatory factors for capital flows into real estate.
THE CEM DATABASE
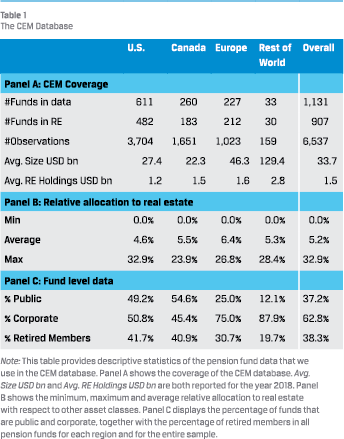 We use data provided by CEM Benchmarking, a firm providing investment benchmarking services to pension funds all over the world. CEM collects investment data from pension funds through a voluntary online reporting process. The CEM database is the broadest global database on pension fund investments, including plan-level data (e.g., fund size and percentage of retirees), strategic asset allocation goals, investment approaches, investment costs, benchmark choices, and performance data. For a review of other studies using the database, see Carlo, Eichholtz and Kok (2021). The database includes 1,131 unique pension funds across five regions over a 28-year period from 1991 to 2018. Most pension funds are from North America (871 funds). The coverage of European funds has increased substantially over the past two decades, with funds from the Netherlands and the United Kingdom accounting for 87% of the total European subsample. Since the number of European pension funds was very low at the beginning of the sample, we only include European pension funds from the year 2000 onwards.
REAL ESTATE ALLOCATIONS HAVE INCREASED FROM 5.6% TO 8.7% OVER THE PAST 20 YEARS, WHICH IS MOSTLY THE RESULT OF RETURN ON INVESTMENT RATHER THAN ADDITIONAL CAPITAL ALLOCATION
The total assets of all pension funds reporting to CEM increased from USD 612 billion in 1991 to USD 10.1 trillion in 2018. This represents a significant portion of total global pension fund assets, which were recently estimated at USD40 trillion worldwide in 2018. Over the entire sample period, the average size of pension funds was USD33.7 billion, with average real estate holdings of USD1.5 billion. The European pension funds reporting to CEM and investing in real estate are significantly larger than their North American counterparts, with an average size of USD46.3 billion and USD1.53 billion in real estate holdings (in 2018), compared to an average size of USD25.7 billion and average real estate holdings of USD1.3 billion for the North American funds. Pension funds from the “Rest of the World” region had an average size of USD129 billion in 2018, but this is driven by a small number of very large funds in the Middle East, China, and South Korea.
We exclude pension funds that do not invest in real estate (see Andonov et al. 2015 for an analysis of real estate allocations at the extensive margin, i.e., the binary choice of investing in real estate, or not). In total, we have 907 pension plans in our sample that invest in real estate, with 6,537 fund/year observations. This implies that the average pension plan investing in real estate remains in the CEM panel for about 7.6 years. For these funds, we collected net asset value for all asset classes and their respective returns net of fees, the strategic asset allocation targets, the percentage of retired members, the size of the fund, and the type of plan (i.e., public and corporate). Within the real estate allocation, we further distinguish between public (i.e., REIT) investments and private investments in real estate.
 FACTSET
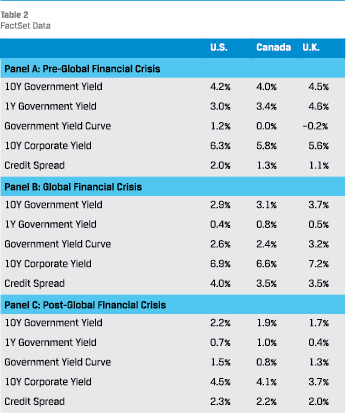
From FactSet, we download several macro variables that we use as explanatory variables for capital flows into real estate, including the 1-year government yield, the 10-year government yield, and the 10-year corporate yield. We also incorporate the term structure by taking the difference between the 10-year and the 1-year government yield (Government Yield Curve). Finally, we create a credit spread (Credit Spread) variable, which is calculated as the difference between the 10-year corporate bond yield and the 10-year government bond yield. Table 2 provides sample statistics. We observe substantial heterogeneity in the cross-section (i.e., across countries) and over time, which we will further examine in our analysis.
CAPITAL FLOWS INTO REAL ESTATE
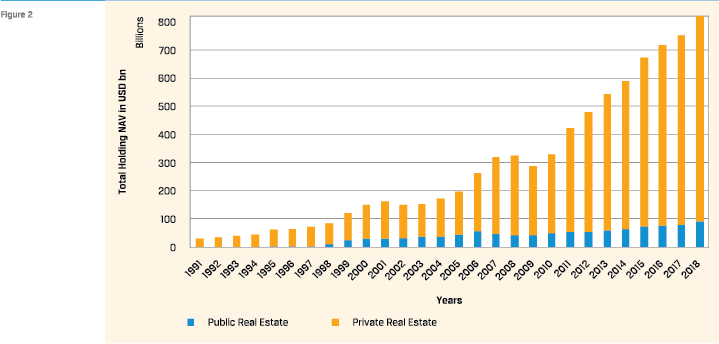
Figure 2 shows the evolution of the total allocation to real estate for pension funds reporting to CEM. The overall allocation has increased from USD28 billion in 1991 to approximately USD 820 billion in 2018.1 This translates into an increase in allocation to real estate from 6.2% to 8.7%, relative to all other asset classes. This increase has been largely monotonic, except for a small decline during the global financial crisis in 2008 and 2009.
It is critical to note that the overall increase in allocation over time is not only the result of additional capital flows allocated to the asset class but is also a result of the net return earned on existing pension plan investments. Since it is our goal to model the dynamics of global institutional net capital flows into and out of real estate, it is important to distinguish between return and net capital flows as the two sources of change in real estate allocations. Therefore, we break down the change in the total real estate allocation into a return component and a capital flow component. First, we measure the annual total change in allocation as the change in the net asset value of the real estate mandates. Then we subtract the net return earned during the year from the total change in allocation. The remaining value is the change in allocation due to capital flows alone. Equation 1 shows the mathematical expression we use to obtain our capital flow variable:

with NAV denoting the intrinsic value and NR the net return, for pension fund i in year t. Generally, when pension funds set their strategic asset allocation target, they commit capital that is not necessarily deployed immediately. In our analysis, we cannot distinguish between capital pledged by a pension fund to a private equity fund (i.e., committed capital) and deployed capital. As a result, in our paper, we assume that the NAV primarily captures the deployed capital.
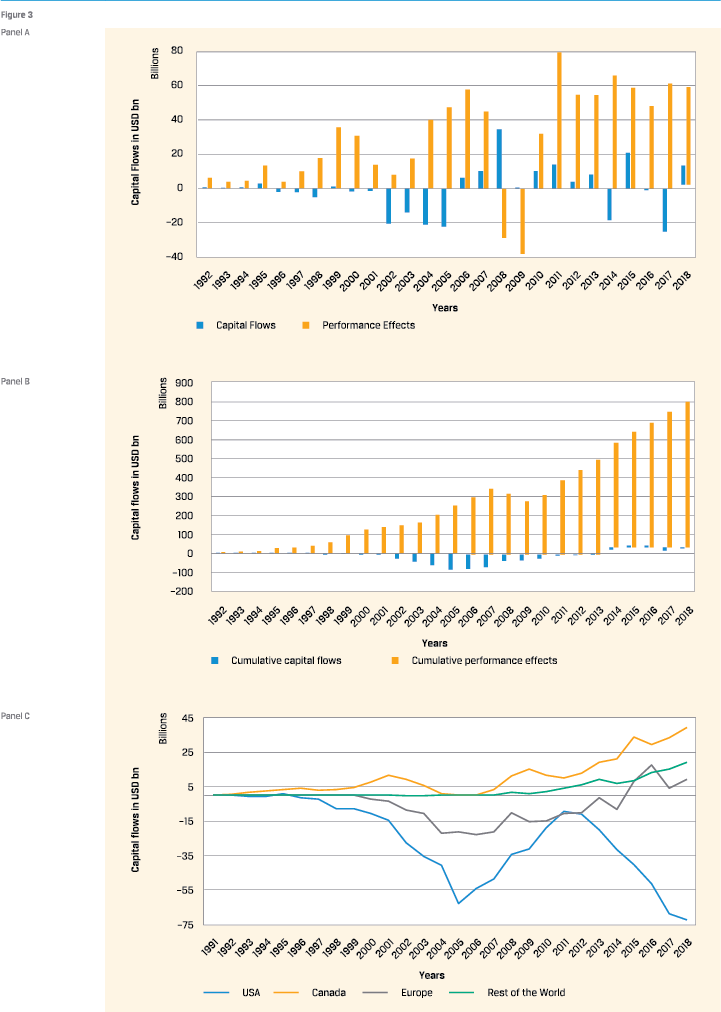
Panel A of Figure 3 shows the annual capital flows to real estate. In the years before the global financial crisis (hereafter “GFC”), the increase in allocation to real estate was primarily due to the positive returns achieved on existing investments. In total, the cumulative absolute real estate returns achieved by the pension funds in our sample up to the year 2007 amounted to about USD356 billion, while about USD67 billion was taken out of real estate mandates during this period (see Panel B of Figure 3). So, the strong returns on real estate allowed pension funds to take capital out of the asset class, while still maintaining their targeted allocation weight to the asset class. One reason could be that pension funds are pulling capital flows out to meet their pension obligations. Another reason could be that pension funds take money out of the asset class to strictly adhere to their strategic asset allocation target. We explore these possibilities later in the article.
We observe the opposite trend during and just after the GFC. When returns turned negative in 2008 and 2009, capital flows to real estate amounted to USD 35 billion and USD 850 million, respectively. It is noteworthy that when the asset class recovered from the crisis and started to post positive returns, net capital flows to the asset class remained positive until the year 2014. One possible reason for this observation is that pension funds aimed to adjust their real estate allocation to pre-crisis period levels, compensating for losses during the crisis (or, of course, to time the market).
WE FIND NO EVIDENCE OF “RETURN CHASING” FOR THE ALLOCATION TO REAL ESTATE BY PENSION FUNDS, WITH PENSION FUNDS RATHER TAKING MONEY OFF THE TABLE AFTER PERIODS OF STRONG PERFORMANCE (AND VICE VERSA)
Figure 3C shows the cumulative sum of capital flows from 1992 to 2018 for each region in the database. Interestingly, Panel C shows considerable heterogeneity across regions. Most notable is the position of pension funds from the U.S. relative to funds from the other regions. Across the sample, U.S. pension funds cumulatively withdrew more capital than they contributed to real estate (i.e., $72.6 billion). Pension funds in the other three regions cumulatively made net contributions to the asset class. In 2018, net cumulative capital flows for Canada, Europe, and the rest of the world were USD39 billion, USD9 billion, and USD19 billion, respectively. Overall, we find that total capital flows into real estate have fluctuated substantially over the past decades, with substantial regional heterogeneity.
THE INTERACTION BETWEEN FLOWS AND RETURNS
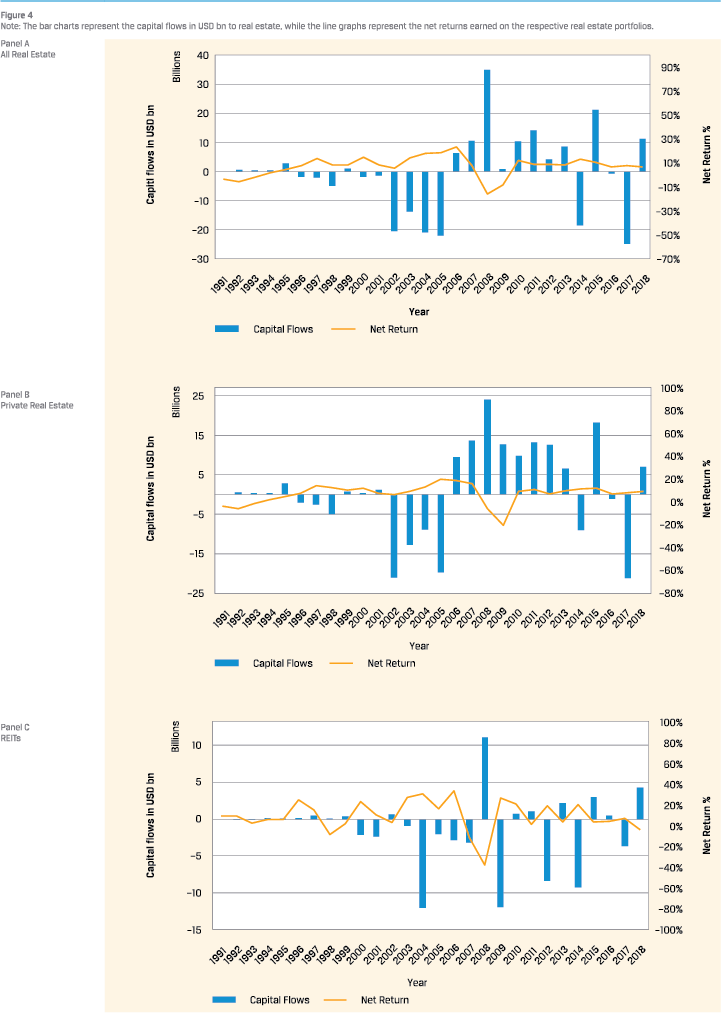
Figure 4A shows global annual capital flows into real estate, measured in billions of U.S. dollars, and the value-weighted net returns over the same period. Panel B shows capital flows for private real estate, and panel C for public real estate. In all three panels, we see a clear negative correlation between asset class returns and capital flows. This is especially evident in the years before the global financial crisis. Between 1991 and 2005, the weighted net return of all real estate was positive every year, while capital flows were negative.
For both private and public real estate, money was taken off the table before the GFC because of the positive returns achieved during that period, but during the global financial crisis, when real estate mandates produced negative returns, capital flows were positive. This is mainly due to the capital flow into private real estate, which has been positive for all years from 1992 to 2014, even though returns had already turned positive by 2010. As stated earlier, a possible reason for this is that pension funds want to increase the allocation back to their strategic goals and add capital to offset the losses incurred.
3 EMPIRICAL APPROACH
The previous section showed some nonparametric insights into the dynamics of capital flows into real estate relative to net returns. However, there are likely more factors that influence capital flows into real estate over time and across pension funds. Using the constructed capital flows variable from equation (1) we perform the following pooled OLS panel regression:

HISTORICAL PERFORMANCE VARIABLES
 CapitalFlowi,t refers to the composite capital flows variable. We first look at returns to real estate and the other major asset classes as explanatory variables. REi,t−1, FIi,t−1, Si,t−1, and OtherAlteri,t−1 are the NAV-weighted lagged net returns for the real estate, fixed income, equity, and “other alternatives” asset classes of pension fund i. FIi,t−1 is added to control for possible “search-for-yield” behavior, which would be reflected in a negative coefficient. Si,t−1 and OtherAlteri,t−1 are added to control for possible different dynamics between the returns of these respective asset classes and the capital flows into real estate. Under OtherAlteri,t−1 we group private equity, hedge funds and the other real asset classes: infrastructure and natural resource mandates. REi,t−1 is added to test for possible “return chasing” behavior by pension funds (in the spirit of Ling and Naranjo, 2003). Furthermore, we add interaction variables between historical performance and a pre-GFC and GFC period. The pre-GFC dummy is equal to 1 for the years before 2008, while the GFC dummy is equal to 1 for the years 2008 and 2009. Regioni represents the region fixed effects, YDt are the year dummies, and µi,t are the idiosyncratic errors. We perform this model specification for both private and public real estate and cluster the standard errors at the fund and year level to control for potentially correlated performance shocks within pension funds and across years.
STRATEGIC ASSET ALLOCATION OBJECTIVE
One possible reason for the link between capital flows and real estate returns is that pension funds strictly follow their predetermined strategic asset allocation target. Thus, capital flows into and out of real estate could partially reflect the mechanism behind how pension funds adjust their actual allocation toward the target allocation. This is measured by including the control variable DiffAlli,t–1, which is constructed as the difference between the target allocation (as reported by the pension fund) and the actual relative allocation. In other words, when the variable is positive, it means that pension funds have an allocation to real estate that is too low relative to the target weight, and vice versa.
LIQUIDITY ISSUES
We include the percentage of retirees in the pension plan to control for pension plan liquidity requirements. A high percentage of retirees relative to the total number of participants could indicate the need for asset classes with higher cash returns, which could make real estate investments more attractive. Thus, we would expect a positive regression coefficient for this variable.
MACROECONOMIC INDICATORS
We further add three macroeconomic indicators as explanatory variables. First, the yield on 10-year government bonds (Gov10Y) as a measure of general investment sentiment and the extent to which investors are “searching for yield.” We also incorporate the term structure by taking the difference between the 10-year and 1-year government bond yields (Yield Curve). This is a measure of investors’ time preference, which can influence their choice of long-term and private assets over more liquid assets. A larger time spread implies that investors are less interested in long-term cash flows, which would make real estate less attractive. Finally, we incorporate risk preferences into the market by adding a credit spread (CreditSpread) variable, which we construct as the difference between the 10-year corporate bond yield and the 10-year government bond yield.
 4 RESULTS
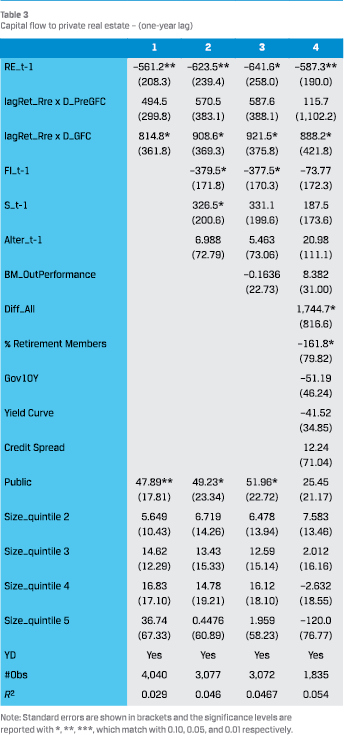
We show the results for allocations to private real estate in Table 3 (results on REIT allocations are reported separately). Column (1) presents the results of the basic specification, in which the main explanatory variable is the one-period lagged return to private real estate mandates. This shows a negative and significant relationship between lagged returns and capital flows to real estate. A one-percentage point increase in the net return on private real estate mandates leads to a negative capital flow from the asset class of $561 million in the following period. Interestingly, we find that the interaction coefficient with the GFC dummy is positive and statistically significant at the 10% level. This means that during the GFC the relationship changed from negative to positive, for a total effect of USD256.6 million for the average pension fund (-560.2+816.8). During the depths of the financial crisis, pension funds did not take advantage of market dislocations, but rather liquidated (more) positions, taking money out of real estate.
The second specification, shown in Column (2), adds the lagged returns on other major asset classes to the model, which yields two interesting observations. First, the coefficients for the lagged returns on fixed income are negative and statistically significant. This could indicate a possible search for returns. If the returns on low-risk assets, such as bonds, fall too much, pension funds may search for yield by moving higher up the risk ladder, possibly leading to a higher allocation to real estate. Korevaar (2022) gives a discussion and analysis of this phenomenon. On the other hand, the coefficient on the lagged return of the government equity portfolio is positive and statistically significant at the 5% level. This may be because high returns increase the allocation to government stocks, forcing pension funds to increase the flow of capital to real estate to maintain their strategic asset allocation target.
In Column (3), we also control for the possible outperformance of the pension fund’s benchmark in the previous period, but we find no statistically significant effect for this variable. Finally, in Column (4), we add the variable “Diff˙All” to the macroeconomic indicators. For “Diff˙All”, we find a negative and significant coefficient, implying that the strategic objective of asset allocation to real estate seems to matter for the actual allocation. For the macroeconomic indicators, we find relationships in the expected direction, but no statistical significance. First, we see that the coefficient on the 10-year government interest rate is negative, as we would expect. This could be a reflecting of a search for yield by pension funds. We see that the coefficient for the yield curve is also negative, which is to be expected because a steeper yield curve implies lower investor demand for long-term cash flow, which likely includes real estate. Finally, the coefficient for the credit spread is positive, but not statistically significant.
PENSION FUNDS DO SEEM TO ENGAGE IN A “SEARCH FOR YIELD,” INCREASING REAL ESTATE ALLOCATIONS WHEN YIELDS ON FIXED INCOME ASSETS ARE LOW.
Overall, the results reported in Table 3 for all four specifications indicate a negative relationship between lagged returns and capital flows to private real estate. The fourth specification shows that a one percent increase in the net return results in a total of USD587.3 million taken off the table for the combined sample of pension funds. This negative relationship is even more evident when we look at the coefficients of the interaction of lagged returns with the pre-crisis and crisis dummies. Interestingly, the coefficients on the lagged return on the fixed income portfolio are negative and statistically significant for three out of four specifications. The coefficient on the interest rate variable points in the same direction, suggesting that pension funds are for searching yield. The results for the macroeconomic indicators all move in the right direction but are not statistically significant for our sample of pension funds.
PUBLIC REAL ESTATE ALLOCATIONS
For private real estate, it is relatively difficult to change the allocation quickly, given its illiquidity. Therefore, we also study the public real estate holdings by pension funds. The regression results for the model that explains capital flows to listed real estate are shown in Table 4, which has the same structure as before. In Column (1) we see that, in contrast to the results for private real estate, the coefficient on lagged returns to real estate mandates is positive, albeit statistically insignificant. We see that the relationship between capital flows and lagged returns on the REIT portfolio is positive, but never statistically significant in any of our model specifications. This is surprising given that it is much easier to adjust the public real estate portfolio than the private real estate portfolio. In Column (2), we see that the coefficient on fixed income portfolio returns is positive, but statistically non-significant, while the coefficient on equities is negative and statistically non-significant. Neither the public market sentiment nor the performance of fixed income portfolios seems to affect the capital allocation to REITs.
In the most complete specification, shown in Column (4), we find that all variables are still statistically insignificant, except for “Diff All.” In other words, as the “underallocation” to public real estate increases by 1 percentage point, capital flows to publicly listed real estate increase by $1.3 billion. This result is statistically significant at the 5 percent level. Overall, the results in Table 4 show that capital flows to REITs depend primarily on the under or over-allocation of the public real estate portfolio relative to the target and not on the historical performance of the public real estate portfolio or any of the other asset classes.
5 CONCLUSION
Pension funds stand at the top of the institutional investment pyramid. Pension fund allocation decisions largely determine capital scarcity or capital excess for various asset classes, including private and public real estate. Yet, we know little about these allocation decisions. This article aimed to shed light on the dynamics of global institutional capital flows into real estate. We look at the universe of pension funds reporting to CEM, which represents about a quarter of total global pension fund assets. Over the past 25 years, these pension funds have gradually increased their allocation to real estate, in absolute and in relative terms. The average allocation to the asset class was 8.7% in 2018, the last year of our sample period, compared to 5.6% in 1998. However, some funds are not investing in the asset class at all, and other funds structurally allocate more than 20% to real estate. We use a panel regression to examine both the dynamics over time and the spread across pension funds. We first explore whether past returns to real estate and other asset classes affect pension funds’ capital flows into and out of real estate. A key question is whether investors engage in return chasing: the extent to which capital flows into an asset class are influenced by past returns of that asset class. We find no evidence of return chasing for the allocation to real estate by pension funds. On the contrary, pension funds reduce their holdings after achieving positive returns on their real estate investments, and increase their holdings after bad returns, presumably to stay in line with their strategic asset allocation. We also find evidence of pension funds increasing their real estate investments after periods when their fixed-income investments have delivered weak returns. This could be a sign of a “search for yield,” with pension funds moving up the risk ladder after experiencing poor returns on their lowest-risk assets. This is consistent with the risk behavior observed in U.S. pension plans due to low funding levels and high return expectations (Andonov et al., 2017). Liquidity considerations do not seem to play an important role in the decision to invest in real estate, as we find no significant difference in real estate allocation between funds with different ratios of retired to active members.
All authors are at Maastricht University’s School of Business and Economics, PO Box 616, 6200 MD, Maastricht, The Netherlands. We thank CEM Benchmarking Inc. of Toronto for generously providing the data for this article and the Real Estate Research Institute for funding the project. Mauricio Rodriguez, Peter Schotman, and John Worth are thanked for their insightful comments and suggestions.
References
- Andonov, A., Delegated Investment Management in Alternative Assets. Working paper, University of Amsterdam, 2022.
- Andonov, A., Bauer, R. and M. Cremers, 2017. Pension Fund Asset Allocation and Liability Discount Rates. The Review of Financial Studies, vol 30 No. 8: 2555-2595.
- Andonov, A., P. Eichholtz and N. Kok, 2015. Intermediated Investment Management in Private Markets: Evidence from Pension Fund Investments in Real Estate. Journal of Financial Markets, vol. 22 January: 73-103
- Carlo, A., Eichholtz, P. and N. Kok, 2021. Three Decades of Global Institutional Investment in Commercial Real Estate. The Journal of Portfolio Management, vol 47 No. 10: 25-40.
- Fisher, J., Ling, D.C. and A. Naranjo, 2009. Institutional Capital Flows and Return Dynamics in Private Commercial Real Estate Markets. Real Estate Economics, vol 37 No. 1: 85-116.
- Froot, K.A., P.G.J. O’Connell and M.S. Seasholes, 2001. The Portfolio Flows of International Investors. Journal of Financial Economics, vol 59 No. 2: 151-194.
- Gompers, P. and J. Lerner, 2000. Money Chasing Deals? The Impact of Fund Inflows on Private Equity Valuations. Journal of Financial Economics, vol 55 No. 2: 281-325.
- Kaplan, S. N. and A. Schoar, 2005. Private Equity Performance: Returns, Persistence, and Capital Flows. The Journal of Finance, vol 60 No. 4: 1791-1823.
- Karceski, J., 2002. Return-Chasing Behavior, Mutual Funds, and Beta’s Death. Journal of Financial and Quantitative Analysis, vol 37 No. 4: 559-594.
- Korevaar, M. Reaching for Yield and the Housing Market: Evidence from 18th-century Amsterdam. Working Paper, Erasmus School of Economics, February 9, 2022. Available at SSRN: https://ssrn.com/abstract=3794782
- Ling, D.C. and A. Naranjo, 2003. The Dynamics of REIT Capital Flows and Returns. Real Estate Economics, vol 37 No. 3: 405-434.
Note
- The increase in capital flows towards real estate is still observable when correcting for the increase in the number of pension funds reporting to the CEM database over the sample period.
in VBA Journaal door Alexander Carlo, Piet Eichholtz and Nils Kok