
With earnings and bond yields now converging and starting to move in the same direction once more, many investors are beginning to wonder what the relationship between the two major asset classes will look like going forward. A prolonged reversal of the stock-bond price correlation from negative to positive would have critical implications for multi-asset class portfolio risk management. Effective diversification relies on assets moving in independent or even opposing directions. If two of the major types of investments in the portfolio were to suddenly march in lockstep, fund managers would have to find alternative ways of reducing their overall risk.
 For the past 20 years, multi-asset class investors have relied on the inverse relationship between equity and bond returns to diversify their portfolio risk. The underlying flight-to-quality flows were fuelled by a succession of financial crises and facilitated by central banks that were only too willing to flood the system with ready cash by vigorously slashing interest rates and buying huge amounts of fixed-income assets. The opposing price movements of stocks and bonds led to a significant divergence of earnings versus sovereign yields. At the same time, inflation remained relatively subdued and close to target levels, despite exceptionally loose monetary conditions.
In late 2016, after almost a decade of near-zero interest rates, the US Federal Reserve was the first major central bank to raise its target rate. Initially, rising bond yields and inflation expectations were seen as a sign of a recovering economy, and share prices climbed, while bond values declined. Yet, when consumer price growth showed signs of overheating in early 2018, traders reacted by selling equity and fixed-income securities in unison. Since then, this pattern has been repeating itself on a regular basis whenever market players seemed to be concerned about inflation.
EQUITIES VERSUS BONDS: COMPETING OR COMPLEMENTARY?
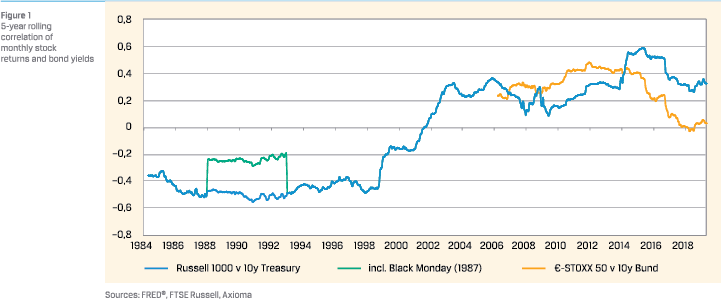 The solid blue line in Figure 1 shows the 5-year rolling correlation of monthly returns for the Russell 1000 US stock index and changes in the 10-year constant-maturity US Treasury yield. While the graph confirms the consistent co-movement of stockmarket returns and government bond yields over the past two decades, it also highlights that that relationship has not always been positive.
In fact, there seems to be evidence that before the turn of the century the interplay between the two time series was negative. Once again, the relationship appeared to have been very stable. The only major disruption occurred on October 19, 1987 (“Black Monday”), when stock markets around the world crashed by more than 20%. Excluding this outlier from the calculation noticeably enhanced the stability of the correlation estimate.
The orange line in Figure 1 shows the interaction of Eurozone stock markets and German Bund yields. While the relationship between the two seemed to have been similarly positive as in the US over the first 15 years of the 21st century, the correlation appeared to have gone down significantly after that. This decoupling of Europe and the United States is no coincidence, as it concurs with the divergence of monetary policies between the Federal Reserve and the European Central Bank in the aftermath of the 2016 US presidential election. As the American stock market embarked on a 40% bull run and the 10-year Treasury yield surged 130 basis points between November 2016 and October 2018, gains were a lot more muted on the other side of the Atlantic. While the Euro STOXX 50 booked only half the profit of its US rival, the rise in the 10-year Bund benchmark was just over 30 basis points.
COMPETING ASSET CLASSES: DISCOUNTED DIVIDENDS AND THE FED MODEL
Another way of looking at the stock-bond market relationship is by comparing the yields on both types of investments. One widely used methodology is the so-called Fed Model – named after a statement made in a Federal Reserve Bank report from 1997 that changes in the average price/earnings ratio of the US stock market had “often been inversely related to changes in long-term Treasury yields”.
One of the underlying arguments behind the Fed Model is that stocks and bonds are competing asset classes, and that investors will prefer the one that promises a higher expected return. When interest rates rise and bond prices fall, fixed-income securities will offer a higher yield. Share prices will then have to fall, too, in order to lift the earnings or dividend yield (earnings or dividend per share divided by share price) to at least the same level as what a lower-risk investment provides.
THE COMPETING ASSETS ARGUMENT IMPLIES A POSITIVE INTERACTION OF STOCKS AND BONDS
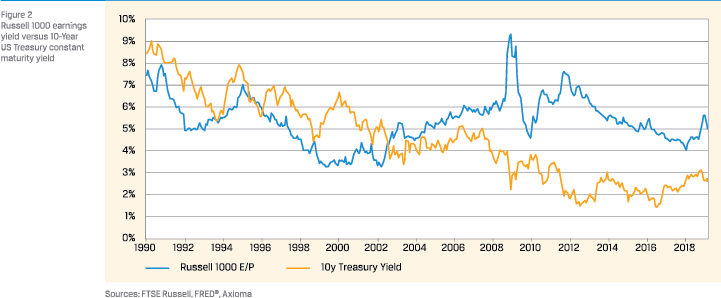 The theory of competing investment types made particular sense during the 1980s and ‘90s, when the liberalisation of financial markets led to an explosion in share and bond ownership, simultaneously lifting the prices and suppressing the yields on both security types. This is reflected in the concurrent downward trend of the average earnings yield of the Russell 1000 benchmark index and the 10-year constant maturity US Treasury yield on the left-hand side of Figure 2.
The ‘regime change’ from co-movement to divergence was brought about by a rapid succession of financial crises in Latin America, East Asia and Russia, culminating in the burst of the technology bubble in early 2000 and the subsequent global recession of 2001. The new environment was dominated by flight-to-quality flows, as investors dumped their risky stock holdings to buy high-quality government securities, leading to opposite movements in earnings and bond yields. Even more severe movements could be observed during the global financial crisis of 2007-8 and the Eurozone debt crisis 2010-12, which ultimately resulted in negative interest rates at the short end of the yield curve and near-zero yields for longer-dated government debt.
Very closely related to the Fed Model is the Dividend Discount Model (DDM). The assumption behind the latter is that the value of a stock is equal to the sum of discounted future dividends. The most popular notation is the so-called Gordon Growth Model, which states that the share price is equal to next year’s dividend divided by a discount rate minus a constant rate, at which future pay-outs are expected to grow.
POSITIVE OR NEGATIVE? IT DEPENDS…
At first glance, both the Fed Model and the Dividend Discount Model imply an inverse relationship between share prices and bond yields. As interest rates rise, stock valuations would have to fall, either because bonds become more attractive due to their higher expected returns or because future earnings/dividends are discounted at higher rates. The opposite would be true, if interest rates were to fall.
However, the implicit assumption is that the earnings or dividends per share remain unaffected by whatever drives interest rates higher or lower. The most obvious drivers would be economic growth, inflation expectations and central bank policy. While the impact of the latter two on bond yields is almost deterministic, the effect on share prices is less straightforward.
The anticipation of stronger consumer price growth will almost certainly lead to lower bond present values, as the coupon payments are fixed (unless they are inflation-linked, of course) and the only way to keep real returns the same is by lowering what buyers have to pay upfront. The effect on a company’s share price, on the other hand, is less self-evident. While the increased discount rate (=required return) will have an adverse effect, higher prices for goods and services can actually boost future earnings and dividends, increasing the numerators of both earnings yield or discounted future cashflows. Thus, the share prices could remain the same or even rise, despite a heightened required return or discount rate.
Lower inflation expectations, on the other hand, are likely to raise bond prices, while the effect on shares once again depends on the underlying reason for the lower consumer price growth. If it is because the central bank is seen as keeping inflation in check, the effect can be neutral or even positive. If it is, however, driven by fears of an economic slowdown or, more severely, a recession, stock markets are likely to fall.
THE SIGN OF THE CORRELATION DEPENDS ON THE LEVEL OF INFLATION EXPECTATIONS
This suggests that the impact of inflation depends on the root cause of the altered expectations and the anticipated reaction from the central bank. Empirical evidence and academic studies both demonstrate that there is a ‘goldilocks’ zone, in which inflation is seen as positive for stocks: strong enough to signal healthy economic growth, but not so high that it will adversely affect corporate profit margins. Once it rises above a certain level, fears of rising wage and input price pressures kick in and share prices start to fall. A deflationary environment, on the other hand, will also be bad for corporate profits.
Overlaid with the more linear dependency of bond prices with inflation, we can identify four zones, which roughly correspond to the stages of an economic cycle. If inflation is too low or even negative, recession and deflation fears will drive investors from risky equities into the relative safety of government bonds, and the two asset classes will be inversely related. When the economy starts to recover, the initial pickup in consumer price growth is seen as positive, and share prices will begin to rise. At the same time, a proactive central bank will start to raise interest rates and bond prices will fall.
There might come a point, at which both the economy and inflation show signs of ‘overheating’. This can go hand in hand with concerns that the central bank may hike rates too aggressively, which will adversely affect both stock and bond prices. The rate setters can then adjust their monetary policy stance to ‘neutral’, which can result in a recovery at both equity and debt markets. All four phases could be observed during the most recent Fed hiking cycle.
THE MOST RECENT RATE-HIKING CYCLE: FROM ‘GOOD’ INFLATION TO ‘BAD’ INFLATION
After almost a decade of ultra-loose monetary policy, the US Federal Reserve Bank was the first of the major central banks to start raising its target rate in December 2016. The move reflected a renewed optimism on the US economy, fuelled by promises of lower taxes and increased infrastructure spending from the newly elected Trump administration. Rising consumer prices were seen as evidence of a healthy, growing economy, and increasing interest rates were considered the natural response from a vigilant and proactive central bank.
This perception completely changed in February 2018, when, seemingly out of the blue, ‘good’ inflation turned into ‘bad’ inflation and equity and bond markets dropped in unison. At the time, a higher-than-expected rise in average hourly earnings, released as part of the monthly US non-farm payroll report, sparked expectations of stronger consumer price growth, which, in turn, would elicit a more aggressive response from the central bank than the previously anticipated gradual upward path. The same motif repeated itself in May and October 2018, when strong growth in producer prices once more fuelled concerns about potential knock-on effects on consumer prices.
The last quarter of 2018 was again another turning point. At the beginning of October, market participants and central bankers were still very optimistic about the global economy. There were ongoing concerns that inflation may overshoot its target range and that the Federal Reserve may have to raise rates at least 3-4 more times. The possibility that the central bank may increase short-term rates too aggressively even sent equity markets into a tailspin. At the same time, the prospect of rising inflation and interest rates also weighed on fixed income markets, depressing bond prices alongside stock values.
Only three months later, as it became clear that economic growth was slowing down around the world and CPI releases started to surprise on the downside, stock markets recovered swiftly from their recent troughs. At the same time, fixedincome assets were lifted by a downward revision of inflation and interest rate expectations, as rate setters on the Federal Open Market Committee (FOMC) altered their rhetoric, using adjectives such as “patient” and “neutral” when describing their policy stance.
INFLATION CONCERNS = CO-MOVEMENT OF STOCK AND BOND PRICES
What was notable about those two market environments – the fear of inflation being too high as well as the subsequent relief that it was not – was that they both led to a similar co-movement of stock and bond prices, albeit in opposite directions. In fact, we have been able to observe this phenomenon of equity and debt markets marching in lockstep whenever markets were focussed on consumer price growth several times during the past 2.5 years.
LASTING POLITICAL UNCERTAINTY ARGUES FOR AN ONGOING INVERSE RELATIONSHIP
Even as far back as summer 2017, when the Federal Reserve Bank became more cautious with regards to price growth, while still maintaining its bullish assessment of the US economy, bond prices rose, as yields fell, while equities continued their ascent. The same pattern could again be observed 4 months later, when minutes from the November FOMC meeting revealed some concerns among rate-setters that inflation was ‘too weak’. Once more, stock and bond prices climbed simultaneously on the news.
CREDIT SPREAD VERSUS INTEREST RATES: THE IMPACT OF MONETARY POLICY
 The concurrent rise of share and bond prices seems to be typical for the final phase of the central bank hiking cycle. As shortterm rates near their peak and economic growth starts to slow down, long-term government bond yields begin to descend and the overall curve flattens or even inverts. The latter is usually seen as a precursor of an impending recession, but historical evidence shows that it can take several months – even up to 2 years – before economic growth actually becomes negative. In the meantime, share prices can continue to rise alongside bonds for even another year, as they did, for example, after the US curve inversion in 2006.
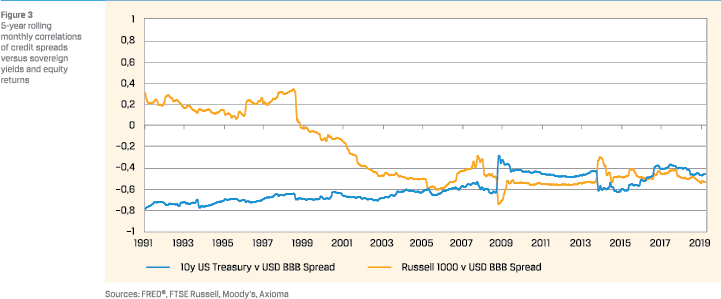
Corporate bond risk premia, however, seem to start widening immediately as long sovereign bond yields begin to decline. In fact, as Figure 3 demonstrates, the inverse relationship between interest rates and credit spreads has been very consistent over the past 30 years at least. The correlation between stock market returns and corporate risk premia, on the other hand, has only been negative since about 1998, while before that it seemed to have been slightly positive.
The reversal of the latter relationship coincided with the period when the interaction of stock and bond prices also flipped signs, as observed in Figure 1. This indicates that the connection between rates and spreads is stronger and more consistent than the link between company values and corporate risk premia. This seems to be even true for issuers of lower credit quality, where one might at least expect a closer relationship between share price and issuer credit spread.
In a series of stress tests we performed on a multi-asset class portfolio based on the curve flattening/inversion phases of rate hiking cycles from the past 25 years, we found that credit spreads tended to widen as soon as long-term government bond yields began to descend. Our results indicated that the relationship was independent of credit rating. However, the negative performance impact was more pronounced on lower-quality securities. While investment-grade issues would at least slightly benefit from lower discount rates, the same effect was outweighed by the higher risk premium for high-yield bonds. The same could be observed for lower-quality emerging market sovereigns.
The results from the stress test seem to support the picture painted by Figure 3 that the inverse interaction between interest rates and spreads appears to be more prevalent than the link with share prices. This means that when earnings and bond yields move in the same direction – as they did in the pre-1998 period – credit spreads are more likely to go the opposite way. It is, once more, exactly what seems to happen during the last phase of the central bank hiking cycle, when corporate risk premia already start to widen, while long-term bond yields fall and share prices continue to climb.
ASSET CLASS CORRELATIONS: THE IMPACT ON PORTFOLIO DIVERSIFICATION
The inverse relationship between stock and bond prices has been an important source of risk reduction for multi-asset class investors. Effective diversification relies on the fact that not all assets in a portfolio move in the same direction. A consistent negative interaction between two asset classes is particularly powerful in reducing overall risk, as losses in one investment are offset by gains in the other. Despite the fact that price movements in the fixed income market are less volatile than those in the equity and FX markets, holding debt securities will still have a notable downward impact on total portfolio risk.
Diversification becomes even more effective, however, when both asset classes have similar volatilities. The Japanese yen is a good example. While it is one of the most volatile developedmarket currencies, it is also very negatively correlated with foreign stock markets. This is because Japanese investors tend to be very risk averse. If things go badly in other parts of the world, they are usually quick to repatriate their money, which then leads to an appreciation of the yen versus the other currencies. Therefore, the yen has been a relatively consistent and reliable diversifier for equity portfolios. However, there is a likely cost involved for holding a JPY position, as the very low or even negative interest rates in the currency can lead to ‘negative carry’.
However, for most other currencies, the interactions of exchange rates with other assets have been a lot less straightforward. Unlike bond yields – and, usually, also share prices – which tend to be relatively strongly correlated even across countries and regions, the value of a currency against its rivals will often be driven by specific factors. For example, the British pound has been mostly uncorrelated with most other currencies for the past 3 years. Normally, low correlation with other asset classes is a desirable property for diversification. However, the pound sometimes reacted very vehemently to the latest developments in the Brexit process and was therefore very risky to hold.
For large reserve currencies, such as the US dollar and the euro, the relationships are even more complex. For example, most of the recent geopolitical conflicts (Syria, North Korea, US-Chinese trade war) somehow involved the United States. Therefore, the pattern was almost always the same: stock markets and dollar down; government bonds, euro and yen up. For European investors, this meant that losses from American stock holdings were amplified by the accompanying dollar depreciation. Even holding US Treasuries did only little to alleviate the often much stronger share price and exchange-rate volatilities.
The picture was different, though, when the risk related to Europe, as, for example, during the various political crises in Italy, France and Germany. In those cases, the euro was very strongly correlated with the stock markets, which meant that losses from European share holdings could be balanced by diversifying into both sovereign bonds and foreign currencies. Such an environment tends to provide the best diversification opportunities for domestic investors.
In times of rising inflation, when stock and bond prices fall in tandem, gold tends to offer some relief, as it is traditionally considered a hedge against rising consumer prices. Also, when there is an expectation of rising interest rates in a particular country or region, the respective currency is likely to appreciate. This means that even when markets are concerned about further rate hikes from the Federal Reserve and US share and bond prices fall together, foreign investors can at least benefit from the accompanying exchange rate gains.
THE STOCK-BOND CORRELATION: WHERE NEXT?
If the correlation between equity and fixed income markets were to indeed turn positive for a prolonged period, it would have considerable consequences for how multi-asset class portfolios would be managed going forward. With one important source of diversification removed, fund managers would have to find alternative ways of reducing overall risk. Spreading investments across other regions and currencies is one way of achieving this. However, the effectiveness of the hedge would depend on the specific currency/region as well as the current focus of market participants.
For the past 20 years, the interaction between stocks and bonds was mostly driven by the amount of risk appetite in the market. Due to the large discrepancy of earnings versus bond yields, shares would under normal market conditions be considered the more attractive investment and investors would prefer a higher allocation towards equities. However, in times of crises, this would quickly be reversed and investors would flee riskier securities for the relative safety of government bonds – despite near-zero expected returns.
As yields on fixed income securities start to rise again – at least in the United States – they may increasingly be seen as an alternative to holding stocks, instead of just a safe haven in times of turmoil. This view is supported by the ‘competing asset classes’ argument behind the Fed Model. Yet, the environment, in which the latter was developed, was also very different to today. As we noted earlier, the last two decades of the 20th century in particular were an unparalleled period of liberalisation in the financial markets.
Another argument against an impending reversal of the stockbond correlation is the unprecedented decoupling of monetary policies among the world’s major central banks. In the past, the Federal Reserve, the European Central Bank (ECB) and the Bank of England (BoE) would raise and lower their reference rates more or less in tandem. In the current cycle, however, the Fed has already hiked eight times and the target rate is already approaching its peak. The ECB, on the other hand, is nowhere near its first upward step, and recent communication from the governing council led traders to push out expectations even further. Meanwhile, the BoE is incapacitated by Brexit unpredictability, and the future direction of its base rate will very much depend on the eventual relationship of Britain with its major trading partners.
Finally, the ongoing political uncertainty around the world is likely to lead to the familiar and frequent flight-to-safety patterns of falling share prices and rising bond values. In particular the continuing success of populist forces in Europe and the potential implications for the future of the European Union are likely to keep interest rates and bond yields at their current low levels for yet a while longer.
References
- Asness, C., 2003, Fight the Fed Model, The Journal of Portfolio Management, Vol. 30 No. 1: 11-24.
- Brown, M., P. Jacobs and D. Rudean, 2015, How to model the impact of an interest rate rise on bonds, equities and other assets using Axioma’s multi-asset class tools, Axioma Research Paper No. 062.
- Ilmanen, A., 2003, Stock-Bond Correlations, The Journal of Fixed Income, Vol. 13 No. 2: 55-66.
- Schon, C., 2018, The year of the central banks, Axioma Research Paper No. 131.
- The Federal Reserve Board, 1997, Humphrey-Hawkins Report. Available via www.federalreserve.gov/boarddocs/hh/1997/ july/reportsection2.htm.
in VBA Journaal door Christoph Schon